GRAPHING RELATIONSHIPS WORKSHEET
Subscribe to our ▶️ YouTube channel 🔴 for the latest videos, updates, and tips.
Problems 1-2 : Use the diagram shown below to answer.

Problem 1 :
The air temperature was constant for several hours at the beginning of the day and then rose steadily for several hours. It stayed the same temperature for most of the day before dropping sharply at sundown. Choose the graph above that best represents this situation.
Problem 2 :
The air temperature increased steadily for several hours and then remained constant. At the end of the day, the temperature increased slightly again before dropping sharply. Choose the graph above that best represents this situation.
Problems 3-4 : Sketch a graph for each situation. Tell whether the graph is continuous.
Problem 3 :
David is selling candles to raise money for the school dance. For each candle he sells, the school will get $2.50. He has 10 candles that he can sell.
Problem 4 :
Monica’s heart rate is being monitored while she exercises on a treadmill. While walking, her heart rate remains the same. As she increases her pace, her heart rate rises at a steady rate. When she begins to run, her heart rate increases more rapidly and then remains high while she runs. As she decreases her pace, her heart rate slows down and returns to her normal rate.
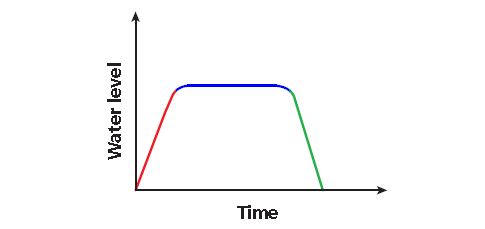
Problems 5-6 : Write a possible situation for the given graph.
Problem 5 :
Problem 6 :
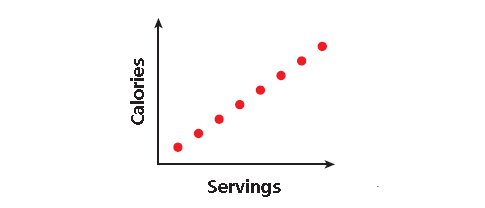
Problem 7 :
Divide each graph into sections when the graph changes directions. The label the sections as increasing, decreasing the same.

Problem 8 :
Rebekah turns on the oven and sets it to 300° F. She bakes a tray of cookies and then turns the oven off.

1) Rebekah turns on the oven sets it to 300° F. She bakes a tray of cookies and then turns the oven off.
a) Graph 1 b) Graph 2 c) Graph 3
d) Graph 4
2) Leon puts ice cubes in his soup to cool it down before eating it.
a) Graph 1 b) Graph 2 c) Graph 3
d) Graph 4
3) Barlee has the flu and her temperature rises slowly until it reaches 101° F.
a) Graph 1 b) Graph 2 c) Graph 3
d) Graph 4
4) On a hot day, Karin walks into and out of an air conditioned building.
a) Graph 1 b) Graph 2 c) Graph 3
d) Graph 4

Detailed Answer Key
1. Answer :
Step 1 :
Read the graphs from left to right to show time passing.
Step 2 :
List key words in order and decide which graph shows them.
Key Words
Segment Description
Graphs
Was constant
Horizontal
Graphs A and B
Rose steadily
Slanting upward
Graphs A and B
Stayed the same
Horizontal
Graph B
Dropped sharply
Slanting downward
Graph B
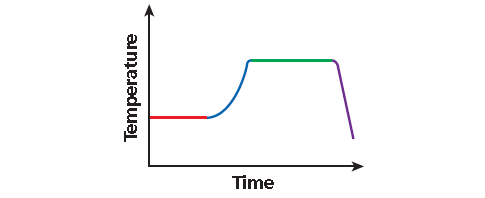
The correct graph is B.
2. Answer :
Step 1 :
Read the graphs from left to right to show time passing.
Step 2 :
List key words in order and decide which graph shows them.
Key Words
Segment Description
Graphs
Increased steadily
Slanting upward
Graphs C
Remained constant
Horizontal
Graphs C
Increased slightly
Slanting upward
Graphs C
Dropping sharply
Slanting downward
Graphs C
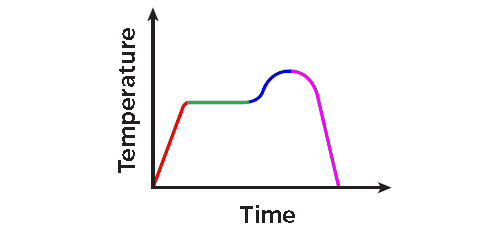
The correct graph is C.
3. Answer :
The amount earned (y-axis) increases by $2.50 for each candle Simon sells (x-axis).
Because David can only sell whole numbers of candles, the graph is 11 distinct points.
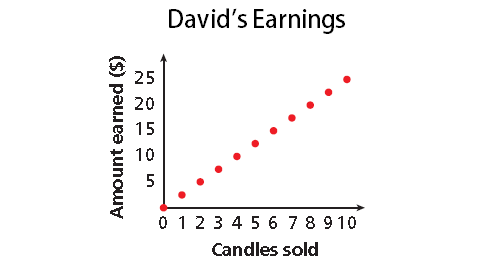
The graph is discrete.
4. Answer :
As time passes during her workout (moving left to right along the x-axis), her heart rate ( y-axis) does the following :
• remains the same,
• rises at a steady rate,
• increases more rapidly (steeper than previous segment),
• remains high,
• slows down,
• and then returns to her normal rate.
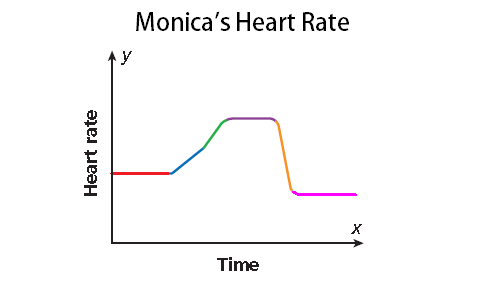
The graph is continuous.
5. Answer :
Step 1 :
Identify labels.
x-axis : time y-axis: water level
Step 2 :
Analyze sections.
Over time, the water level
• increases steadily,
• remains unchanged,
• and then decreases steadily.
Possible Situation :
A watering can is filled with water. It sits for a while until some flowers are planted. The water is then emptied on top of the planted flowers.
6. Answer :
Step 1 :
Identify labels.
x-axis : servings
y-axis : calories
Step 2 :
Analyze sections.
Calorie increases for every increase in serving.
Possible Situation :
The more servings you have of a food or drink, the more calories you consume. Serving size and calories go hand-in-hand. Be sure to look at both of these on food labels and make the healthy choice!
7. Answer :

Observing the graph, it is divided into four parts. In some of the parts it is horizontal, somewhere it going down, somewhere going up. Labelling it, we get

8. Answer :
1) Rebekah turns on the oven sets it to 300° F. She bakes a tray of cookies and then turns the oven off.
It reaches 300° F, after it turns off the temperature will be the same in oven. After sometime it will cool down. So, Graph 3

2) Leon puts ice cubes in his soup to cool it down before eating it.
When he puts ice cubes in his soup the temperature will be reduced and melt. So, graph 4.

3) Barlee has the flu and her temperature rises slowly until it reaches 101° F.
It reaches a particular temperature and the temperature remains same. So, graph 1

4) On a hot day, Karin walks into and out of an air conditioned building.
When he is entering into air conditioned room, the temperature will stay same. When comes out temperature will be high. So, graph 2.

Subscribe to our ▶️ YouTube channel 🔴 for the latest videos, updates, and tips.
Kindly mail your feedback to v4formath@gmail.com
We always appreciate your feedback.
About Us | Contact Us | Privacy Policy
©All rights reserved. onlinemath4all.com

Recent Articles
-
10 Hard SAT Math Questions
Feb 03, 26 02:17 AM
10 Hard SAT Math Questions -
Challenging SAT Math Questions
Feb 03, 26 12:17 AM
Challenging SAT Math Questions -
SAT Math Problems and Solutions
Feb 02, 26 09:11 PM
SAT Math Problems and Solutions