GRAPHING SINE FUNCTIONS
Subscribe to our ▶️ YouTube channel 🔴 for the latest videos, updates, and tips.
The trigonometric ratios can also be considered as functions of a variable which is the measure of an angle. This angle measure can either be given in degrees or radians.
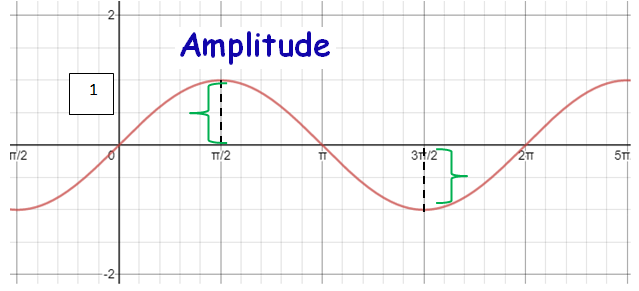
Amplitude
The Amplitude is the height from the center line to the peak (or to the trough). Or we can measure the height from highest to lowest points and divide that by 2.
Period
The Period goes from one peak to the next (or from any point to the next matching point).
Period = 2π/|b|

Frequency
The frequency is simply reciprocal of the period. It is the number of complete cycles the wave completes in unit interval.
Frequency = |b|/2π
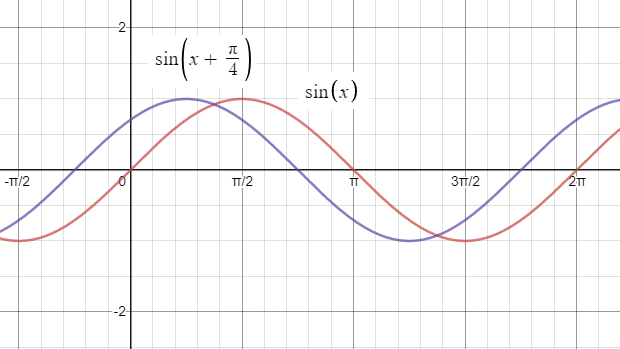
Phase Shift
The Phase Shift is how far the function is shifted horizontally from the usual position.
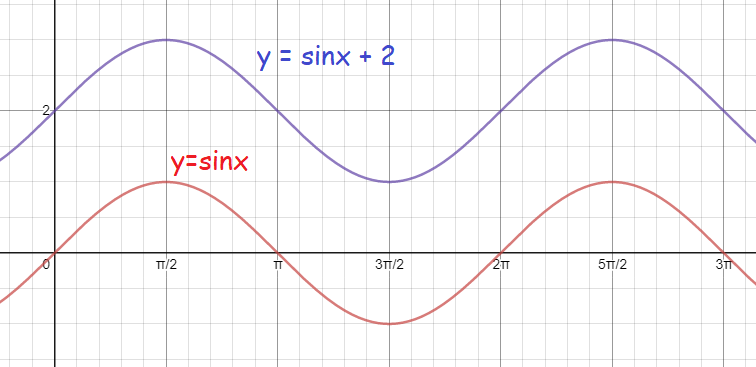
Vertical Shift
The Vertical Shift is how far the function is shifted vertically from the usual position.
Graphing Sine Functions
Example 1 :
Using degrees, find the amplitude and period of each function. Then graph.
y = sinx
Solution :
|
Amplitude = |a| = |1| = 1 |
Period = 2π/|b| = 2π/|1| Period = 2π |
There is no phase shift and vertical shift. To find the points on the x axis, we need to divide the period by 4.
2π/4 = π/2
So, the points on the x-axis are 0, π/2, π, 3π/2 and 2π.

The points are (0, 0) (π/2, 1) (π, 0) (3π/2, -1) and (2π, 0)

Example 2 :
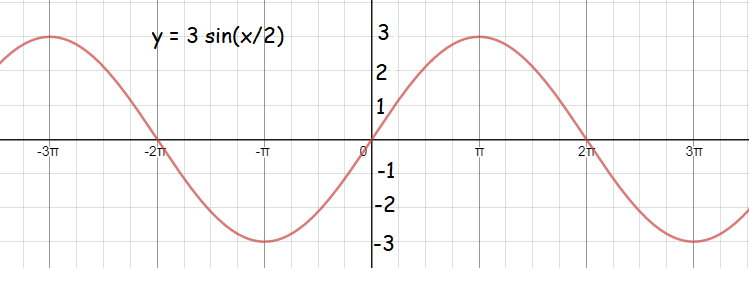
Find the amplitude, period and frequency of the of the function and use this information to sketch the graph of the function in the [-3π, 3π] by [-4, 4].
y = 3sin (x/2)
Solution :
|
Amplitude = |a| = |3| = 3 |
Period = 2π/|b| = 2π/|1/2| Period = 4π |
To find the points on the x axis, we need to divide the period by 4.
4π/4 = π
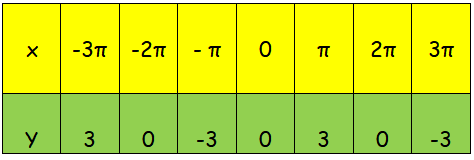
So, the points on the x-axis are 0, π, 2π, 3π and 4π. Since the graph starts from -3π, we need to start from -3π.
The points are (-3π, -3) (-2π, 0) (-π, -3) (0, 0) (π, 3) (2π, 0) and (3π, -3
Example 3 :
Find the amplitude, period and frequency of the of the function then graph the function.
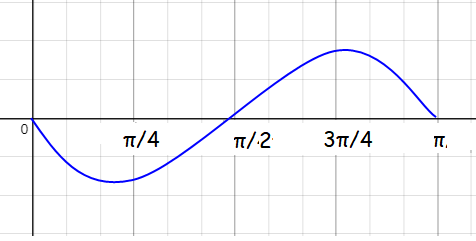
y = (-3/2)sin (2x)
Solution :
|
Amplitude = |a| = |-3/2| = 3/2 |
Period = 2π/|b| = 2π/|2| Period = π |
To find the points on the x axis, we need to divide the period by 4.
π/4
So, the points on the x-axis are 0, π/4, π/2, 3π/4 and π.

Without using technology, sketch the graphs of the following for 0 ≤ x ≤ 2π
Example 4 :
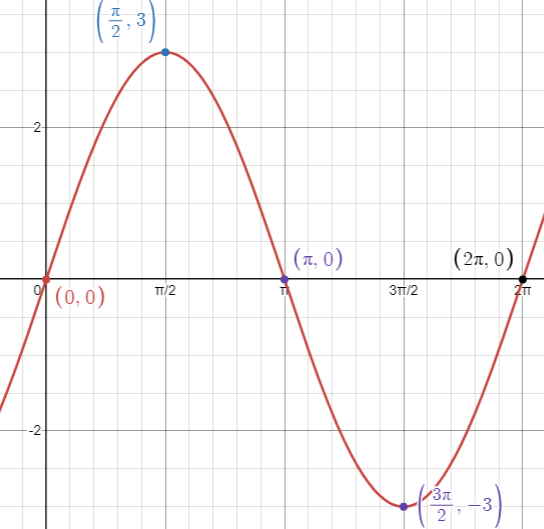
y = 3sin x
Solution :
y = 3sin x
y = a sin (bx + c) + d
|
Amplitude = |a| = |3| = 3 |
Period = 2π/|b| = 2π/|1| Period = 2π |
Inputs are 0, π/2, π, 3π/2 and 2π
y = 3sin x
|
When x = 0 y = 3 sin (0) y = 0 |
When x = π/2 y = 3 sin (π/2) y = 3(1) y = 3 |
|
When x = π y = 3 sin (π) y = 3(0) y = 0 |
When x = 3π/2 y = 3 sin (3π/2) y = 3 (-1) y = -3 |
When x = 2π
y = 3 sin (2π)
y = 3 (0)
y = 0
So, the points are
(0, 0) (π/2, 3) (π, 0) (3π/2, -3) and (2π, 0)
Example 5 :
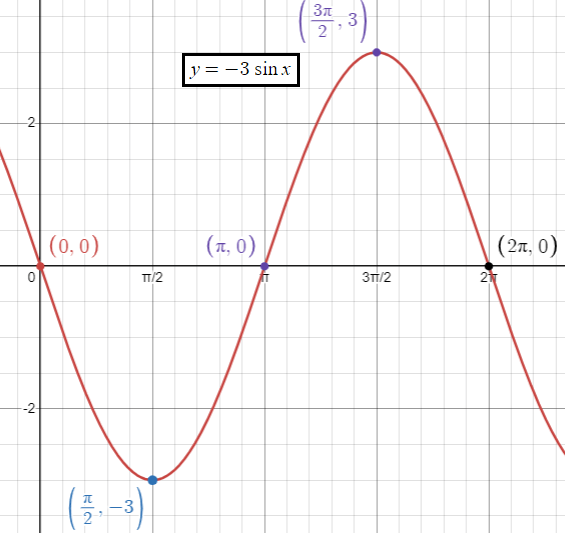
y = -3 sin x
Solution :
y = -3sin x
y = a sin (bx + c) + d
Since a is less than 0, there is reflection across x-axis.
|
Amplitude = |a| = |-3| = 3 |
Period = 2π/|b| = 2π/|1| Period = 2π |
Inputs are 0, π/2, π, 3π/2 and 2π
y = -3sin x
|
When x = 0 y = -3 sin (0) y = 0 |
When x = π/2 y = -3 sin (π/2) y = -3(1) y = -3 |
|
When x = π y = -3 sin (π) y = -3(0) y = 0 |
When x = 3π/2 y = -3 sin (3π/2) y = -3 (-1) y = 3 |
When x = 2π
y = -3 sin (2π)
y = -3 (0)
y = 0
So, the points are
(0, 0) (π/2, -3) (π, 0) (3π/2, 3) and (2π, 0)
Example 6 :
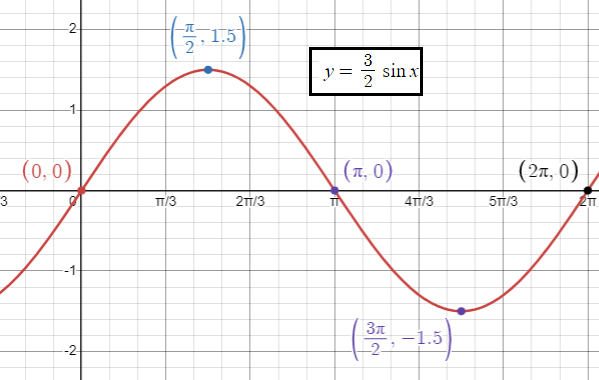
y = (3/2) sin x
Solution :
y = (3/2) sin x
y = a sin (bx + c) + d
a > 0, there is no reflection.
|
Amplitude = |a| = |3/2| = 3/2 |
Period = 2π/|b| = 2π/|1| Period = 2π |
Inputs are 0, π/2, π, 3π/2 and 2π
y = (3/2) sin x
|
When x = 0 y = (3/2) sin (0) y = 0 |
When x = π/2 y = (3/2) sin (π/2) y = 3/2 (1) y = 3/2 |
|
When x = π y = (3/2) sin (π) y = 3/2 (0) y = 0 |
When x = 3π/2 y = (3/2) sin (3π/2) y = 3/2 (-1) y = -3/2 |
When x = 2π
y = (3/2) sin (2π)
y = 3/2 (0)
y = 0
So, the points are
(0, 0) (π/2, 3/2) (π, 0) (3π/2, -3/2) and (2π, 0)
Subscribe to our ▶️ YouTube channel 🔴 for the latest videos, updates, and tips.
Kindly mail your feedback to v4formath@gmail.com
We always appreciate your feedback.
About Us | Contact Us | Privacy Policy
©All rights reserved. onlinemath4all.com
Recent Articles
-
AP Calculus BC Problems with Solutions
Dec 20, 25 10:51 AM
AP Calculus BC Problems with Solutions -
AP Precalculus Problems and Solutions (Part - 1)
Dec 20, 25 10:49 AM
AP Precalculus Problems and Solutions (Part - 1) -
AP Calculus AB Problems with Solutions (Part - 1)
Dec 20, 25 10:49 AM
AP Calculus AB Problems with Solutions (Part - 1)
