HOW TO FIND DOMAIN AND RANGE OF A MAPPING DIAGRAM
Subscribe to our ▶️ YouTube channel 🔴 for the latest videos, updates, and tips.
Domain :
The domain of a function f(x) is the set of all values for which the function is defined
Range :
The range of the function is the set of all values that f takes.
They may also have been called the input and output of the function.) .
Example 1 :
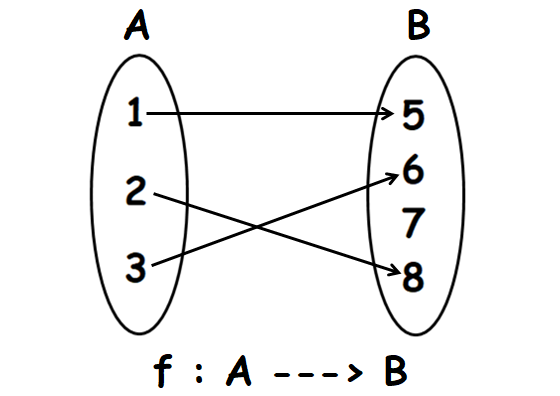
Examine whether the following mapping diagram represents function or not, find its domain, range and co-domain.
Solution :
Every element of A is associated with exactly one element in B. So, it is function.
Domain = {1, 2, 3}
Range = {5, 6, 8}
Co-domain = {5, 6, 7, 8}
Example 2 :
Solution :
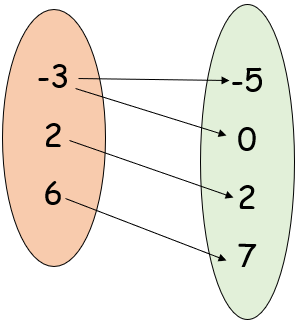
By observing the mapping, it is clear it is not a function. Because -3 is having more than one image.
Domain = {-3, 2, 6}
Range = {-5, 0, 2, 7}
Co domain = {-5, 0, 2, 7}
Example 3 :
Solution :
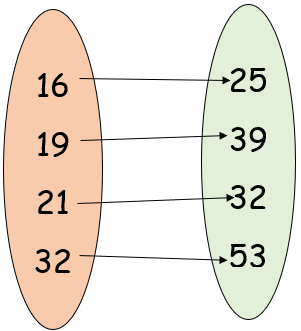
By observing the mapping, it is a function.
Domain = {16, 19, 21, 22}
Range = {25, 39, 32, 53}
Co domain = {25, 39, 32, 53}
Example 4 :
Solution :
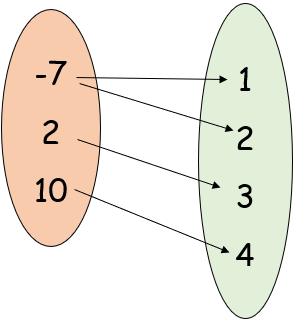
By observing the mapping, it is not a function. Because -7 is having more than one image.
Domain = {-7, 2, 10}
Range = {1, 2, 3, 4}
Co domain = {1, 2, 3, 4}
Write the ordered pairs associated with each mapping diagram. Then state if the relation is a function.
Example 5 :

Solution :
The ordered pairs which is shown in the above mapping diagram,
(1, 1) (2, 4) (3, 9) and (4, 16)
This relation represents a function.
Example 6 :

Solution :
The ordered pairs which is shown in the above mapping diagram,
(-5, 11) (-4, 6) (-2, -4) (0, -14) (2, -24)
This relation represents a function.
Example 7 :
If (4x + 2, 2y – 3) = (4, 3) find the values of x, y?
Solution :
(4x + 2, 2y – 3) = (4, 3)
Comparing the corresponding terms, we get
|
4x + 2 = 4 4x = 4 - 2 4x = 2 x = 2/4 x = 1/2 |
2y - 3 = 3 2y = 3 + 3 2y = 6 y = 6/2 y = 3 |
So, the values of x and y are 1/2 and 3 respectively.
Show each set of data in a mapping diagram. Then state if the relation is a function.
Example 8 :
{(-5, 6) (-4, 9) (-3, 1) (-5, -6) (1, -2) (3, 8) and (8, 8)}
Solution :
By representing the set of ordered pairs in arrow diagram, we get

This relation is not a function.
Write the Domain and Range for the following Relations?
Example 9 :
R₁ = {(6, 2); (6, 5); (3, 5); (0, 8); (7, 3)}
Solution :
Domain = {0, 3, 6, 7}
Range = {2, 3, 5, 8}
Example 10 :
R₂ = {(x, 2); (y, 3); (z, 2); (u, 6)}
Solution :
Domain = {x, y, z, u}
Range = {2, 3, 6}
Example 11 :

a) Domain
b) Range
c) Find f(3)
Solution :
a) Domain = {-1, 1, 2, 3}
b) Range = {-2, -1, 0, 2}
1 is associated with more than one term, then it is not a function.
c) f(3) = 2
Example 12 :

a) Domain
b) Range
c) Find f(0)
Solution :
a) Domain = -3 ≤ x < 3
b) Range = 0 ≤ y ≤ 3
Using vertical line test, the vertical line is intersecting the graph at one point maximum. Then this relationship represents the function.
c) f(0) = 3
Determine the independent and dependent variable for each function.
Example 13 :
The air pressure inside a tire increases with the temperature.
Solution :
Temperature is the independent variable and air pressure is the dependent variable.
Example 14 :
The Spanish classes are having a fiesta lunch. Each student that attends is to bring a Spanish side dish or dessert. The more students that attend, the more food there will be
Solution :
- Number if students attend is independent variable
- number of food items is dependent variable.
Example 15 :
The table shows the number of songs played by four bands at a festival and the amount of time each band played.
Use the table to draw a mapping diagram. Let the number of songs played be the inputs and the times onstage be the outputs.

Solution :
Let the number of songs played be the inputs and the times onstage be the outputs.
Inputs: 7, 8, 10, 14
Outputs: 45, 60, 90

Example 16 :
Describe the pattern in the mapping diagram. Copy and complete the diagram.

Solution :
By observing the inputs and outputs, every input is multiplied by 4.
When,
- input = 1, output = 4
- input = 2, output = 8
- input = 3, output = 12
- input = 4, output = 16
- input = 5, output = 20
- input = 6, output = 24
Example 17 :
A store sells previously viewed movies. The table shows the cost of buying 1, 2, 3, or 4 movies.
a. Use the table to draw a mapping diagram.
b. Describe the pattern. How does the cost per movie change as you buy more movies?

Solution :
a) Mapping diagram :

b) When number of tickets = 1, the amount paid = $10
number of tickets = 2, the amount paid = $18
number of tickets = 3, the amount paid = $24
number of tickets = 4, the amount paid = $28
- Difference between 18 and 10 is 8
- Difference between 24 and 18 is 6
- Difference between 28 and 24 is 4
Subscribe to our ▶️ YouTube channel 🔴 for the latest videos, updates, and tips.
Kindly mail your feedback to v4formath@gmail.com
We always appreciate your feedback.
About Us | Contact Us | Privacy Policy
©All rights reserved. onlinemath4all.com
Recent Articles
-
10 Hard SAT Math Questions (Part - 42)
Dec 30, 25 05:52 AM
10 Hard SAT Math Questions (Part - 42) -
10 Hard SAT Math Questions (Part - 38)
Dec 29, 25 04:21 AM
 10 Hard SAT Math Questions (Part - 38)
 -
10 Hard SAT Math Questions (Part - 39)
Dec 28, 25 11:20 PM
10 Hard SAT Math Questions (Part - 39)
