INTERPRETING CLUSTERS AND OUTLIERS
Subscribe to our ▶️ YouTube channel 🔴 for the latest videos, updates, and tips.
Cluster :
This is a set of closely grouped data. Data may cluster around a point or along a line.
Outlier :
This is a data point that is completely different from the rest of the data in the set.
Clusters and Outliers - Interpretation
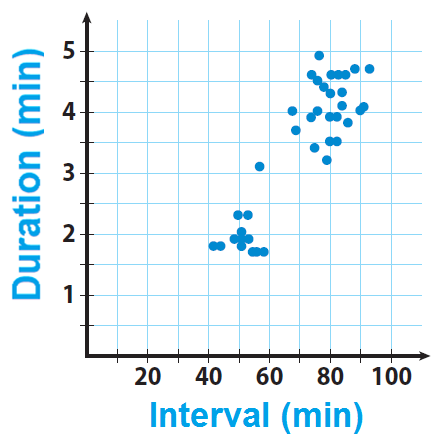
A scientist gathers information about the eruptions of a geyser in a national park. He uses the data to create a scatter plot. The scatter plot shows the length of time between eruptions (interval) and how long the eruption lasts (duration).

Interpretation :
Step 1 :
Describe any clusters you see in the scatter plot.
There are clusters around the 50-minute and 80-minute intervals.
Step 2 :
What do the clusters tell you about eruptions of the geyser ?
There are short wait times followed by short eruptions and longer wait times followed by longer eruptions.
Step 3 :
Describe any outliers you see in the scatter plot.
The point near (57, 3) appears to be an outlier because it does not fall into either cluster.
Step 4 :
Suppose the geyser erupts for 2.2 minutes after a 75-minute interval. Would this point lie in one of the clusters? Would it be an outlier ? Explain your answer.
No, the interval was too long for the first cluster, and the duration was too short for the second cluster. It might be considered an outlier because it is not very close to the rest of the data.
Step 5 :
Suppose the geyser erupts after an 80-minute interval. Give a range of possible duration times for which the point on the scatter plot would not be considered an outlier. Explain your reasoning.
3 to 5 minutes
The duration for other data points on the scatter plot that have an interval of 80 minutes are within this range.
Key Point :
There is no special rule that tells us whether or not a point is an outlier in a scatter plot. When doing more advanced statistics, it may become helpful to invent a precise definition of "outlier", but we don't need that yet.
Subscribe to our ▶️ YouTube channel 🔴 for the latest videos, updates, and tips.
Kindly mail your feedback to v4formath@gmail.com
We always appreciate your feedback.
About Us | Contact Us | Privacy Policy
©All rights reserved. onlinemath4all.com

Recent Articles
-
10 Hard SAT Math Questions (Part - 40)
Dec 25, 25 08:30 AM
10 Hard SAT Math Questions (Part - 40) -
10 Hard SAT Math Questions (Part - 41)
Dec 24, 25 07:58 PM
10 Hard SAT Math Questions (Part - 41) -
ASTC Formula in Trigonometry
Dec 23, 25 11:34 PM
ASTC Formula in Trigonometry - Concepts - Examples and Solved Problems


