INVESTIGATING A CONSTANT RATE OF CHANGE
Subscribe to our ▶️ YouTube channel 🔴 for the latest videos, updates, and tips.
A rate of change is a rate that describes how one quantity changes in relation to another quantity. if x is the independent variable and y is the dependent variable, then
Rate of change = change in y / change in x
Rates of change can be positive or negative. This corresponds to an increase or decrease in the y - value between the two data points. When a quantity does not change over time, it is called zero rate of change.
Let us see how to investigate a constant rate of change through the following example.
Example :
The U.S. Department of Agriculture defines heavy rain as rain that falls at a rate of 1.5 centimeters per hour.
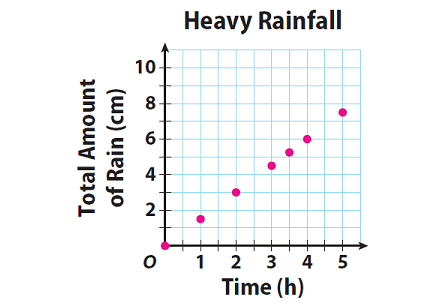
The table shows the total amount of rain that falls in various amounts of time during a heavy rain.

A. Plot the ordered pairs from the table on the coordinate plane at the right.

B. In the graph, plot the point corresponding to 3.5 hours of heavy rain. And also find the total amount of rain in 3.5 hours.
5.25 cm
C. What do you notice about all of the points you plotted ?
All of the points lie along a line.
D. How can we decide from the graph that there is a constant rate of change ?
Since the graph of the given data is a straight line, we can decide that there is a constant rate of change.
E. Is the total amount of rain that falls a function of the number of hours that rain has been falling ? Why or why not ?
Yes.
For any given input of time, there can be one and only one output of total amount of rain.
F. Suppose you continued to plot points for times between those in the table, such as 1.2 hours or 4.5 hours. What can you say about the locations of these points ?
The points would fill in the gaps along the line determined by the existing points of the graph.
Subscribe to our ▶️ YouTube channel 🔴 for the latest videos, updates, and tips.
Kindly mail your feedback to v4formath@gmail.com
We always appreciate your feedback.
About Us | Contact Us | Privacy Policy
©All rights reserved. onlinemath4all.com
Recent Articles
-
10 Hard SAT Math Questions (Part - 40)
Dec 23, 25 06:12 AM
10 Hard SAT Math Questions (Part - 40) -
AP Calculus BC Problems with Solutions
Dec 20, 25 10:51 AM
AP Calculus BC Problems with Solutions -
AP Precalculus Problems and Solutions (Part - 1)
Dec 20, 25 10:49 AM
AP Precalculus Problems and Solutions (Part - 1)
