LINEAR FUNCTIONS
Subscribe to our ▶️ YouTube channel 🔴 for the latest videos, updates, and tips.
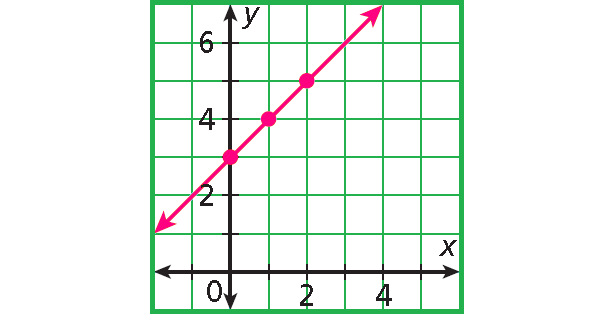
The graph shown below represents a function, because each domain value (x-value) is paired with exactly one range value (y-value).
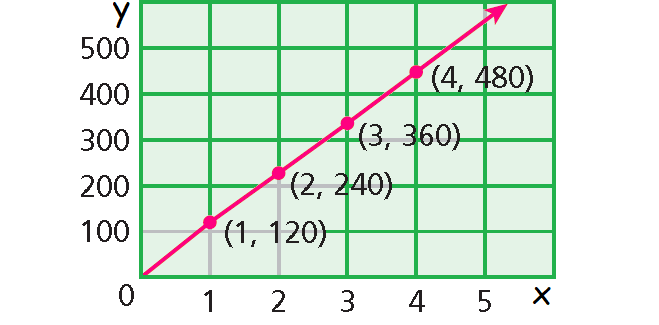
Notice that the graph is a straight line. A function whose graph forms a straight line is called a linear function.
Identifying a Linear Function by Its Graph
Identify whether each graph represents a function. Explain. If the graph does represent a function, is the function linear?
Example 1 :
Solution :
Each domain value is paired with exactly one range value. The graph forms a line.
linear function
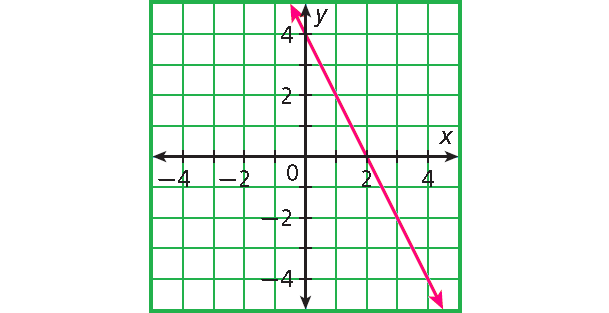
Example 2 :
Solution :
Each domain value is paired with exactly one range value. The graph is not a line.
not a linear function
Example 3 :
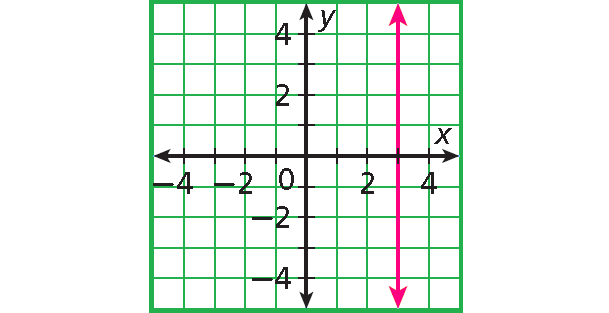
Solution :
The only domain value, 3, is paired with many different range values.
not a function
Identifying a Linear Function by Using Ordered Pairs
You can sometimes identify a linear function by looking at a table or a list of ordered pairs. In a linear function, a constant change in x corresponds to a constant change in y.
Tell whether each set of ordered pairs satisfies a linear function. Explain.
Example 4 :
{(2, 4), (5, 3), (8, 2), (11, 1)}
Solution :
Write the ordered pairs in a table and look for a pattern.
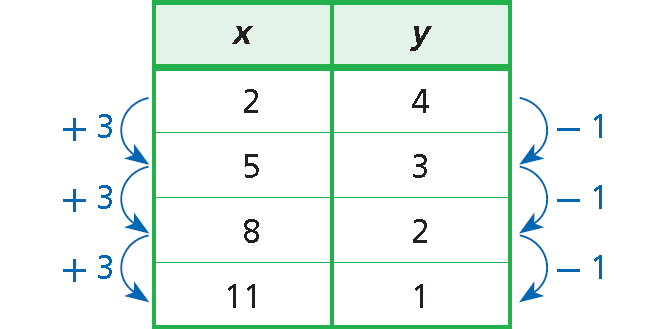
A constant change of +3 in x corresponds to a constant change of -1 in y.
These points satisfy a linear function.
Example 5 :
{(-10, 10), (-5, 4), (0, 2), (5, 0)}
Solution :
Write the ordered pairs in a table and look for a pattern.
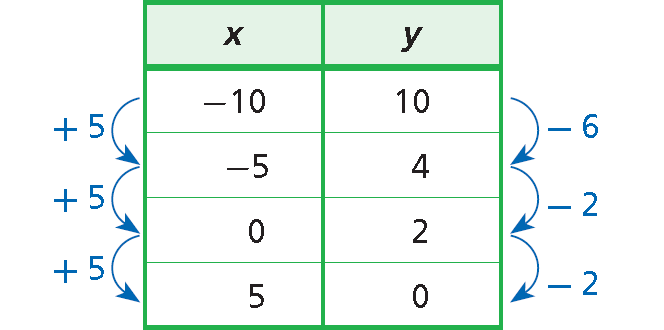
A constant change of +5 in x corresponds to different changes in y.
These points do not satisfy a linear function.
Linear Equation
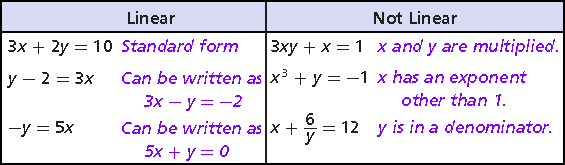
Another way to determine whether a function is linear is to look at its equation. A function is linear if it is described by a linear equation. A linear equation is any equation that can be written in the standard form shown below.
Standard Form of a Linear Equation
Ax + By = C
where A, B, and C are real numbers and A and B are not both 0.
Notice that when a linear equation is written in standard form
• x and y both have exponents of 1.
• x and y are not multiplied together.
• x and y do not appear in denominators, exponents, or radical signs.
For any two points, there is exactly one line that contains them both. This means you need only two ordered pairs to graph a line.
Graphing Linear Functions
Tell whether each function is linear. If so, graph the function.
Example 6 :
y = x + 3
Solution :
y = x + 3
Write the equation in standard form.
Subtract x from each side.
-x + y = 3
The equation is in standard form (A = -1, B = 1, C = 3).
The equation can be written in standard form, so the function is linear.
To graph, choose three values of x, and use them to generate ordered pairs. (You only need two, but graphing three points is a good check.)
x
y = x + 3
(x, y)
0
1
2
y = 0 + 3 = 3
y = 1 + 3 = 4
y = 2 + 3 = 5
(0, 3)
(1, 4)
(2, 5)
Plot the points and connect them with a straight line.
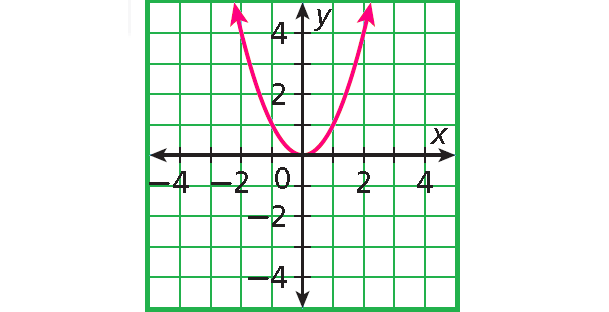
Example 7 :
y = x2
Solution :
y = x2
This is not linear, because x has an exponent other than 1.
For linear functions whose graphs are not horizontal, the domain and range are all real numbers. However, in many real-world situations, the domain and range must be restricted. For example, some quantities cannot be negative, such as time.
Sometimes domain and range are restricted even further to a set of points. For example, a quantity such as number of people can only be whole numbers. When this happens, the graph is not actually connected because every point on the line is not a solution. However, you may see these graphs shown connected to indicate that the linear pattern, or trend, continues.
Career Application
Example 8 :
Lily rents a manicure station in a salon and pays the salon owner $5.50 for each manicure she gives. The amount Lily pays each day is given by f (x) = 5.50x, where x is the number of manicures. Graph this function and give its domain and range.
Solution :
Choose several values of x and make a table of ordered pairs.
|
x |
f(x) = 5.50x |
|
0 1 2 3 4 5 |
f(0) = 5.50(0) = 0 f(1) = 5.50(1) = 5.50 f(2) = 5.50(2) = 11.00 f(3) = 5.50(3) = 16.50 f(4) = 5.50(4) = 22.00 f(5) = 5.50(5) = 27.50 |
Graph the ordered pairs.
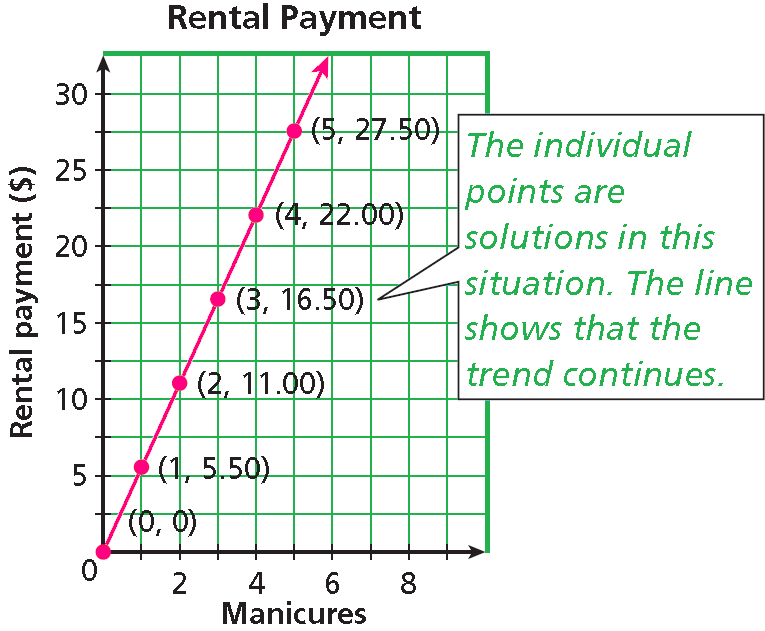
The number of manicures must be a whole number, so the domain is
{0, 1, 2, 3, .......}
The range is
{0, 5.50, 11.00, 16.50, .......}
Subscribe to our ▶️ YouTube channel 🔴 for the latest videos, updates, and tips.
Kindly mail your feedback to v4formath@gmail.com
We always appreciate your feedback.
About Us | Contact Us | Privacy Policy
©All rights reserved. onlinemath4all.com
Recent Articles
-
10 Hard SAT Math Questions (Part - 38)
Dec 29, 25 04:21 AM
 10 Hard SAT Math Questions (Part - 38)
 -
10 Hard SAT Math Questions (Part - 39)
Dec 28, 25 11:20 PM
10 Hard SAT Math Questions (Part - 39) -
10 Hard SAT Math Questions (Part - 41)
Dec 28, 25 06:05 PM
 10 Hard SAT Math Questions (Part - 41)

