SHIFTING GRAPH UP AND DOWN EXAMPLES
Subscribe to our ▶️ YouTube channel 🔴 for the latest videos, updates, and tips.
About "Shifting Graph Up and Down Examples"
Shifting Graph Up and Down Examples :
Here we are going to see some examples to learn how to shift the graph up or down.
Shifting a graph up or down :
Suppose f is a function and a > 0. Define functions g and h by
g(x) = f(x) + a and h(x) = f(x) − a.
Then,
- The graph of g is obtained by shifting the graph of f up a units
- The graph of h is obtained by shifting the graph of f down a units.
- g and h have the same domain as f
- The range of g is obtained by adding a to every number in the range of f ;
- The range of h is obtained by subtracting a from every number in the range of f ;
Question 1 :
Define a function g by
g(x) = f(x) + 1,
where f is the function defined by f(x) = x2, with the domain of f the interval [−1, 1].
(a) Find the domain of g.
(b) Find the range of g.
(c) Sketch the graph of g.
Solution :
(a) Here g(x) is defined precisely defined by f(x). In other words, the domain of g equals the domain of f. Thus the domain of g is the interval [−1, 1].
(b) To find the range of g, we have to apply the values that we find the domain of g.
By adding every number with the of f, we may find the range of g.
f(x) = x2
If x = -1, then y = 1
If x = 0, then y = 0
If x = 1, then y = 1
Range of f is [0, 1]. By adding 1 to every values, we get the range of the function g(x) is [1, 2].
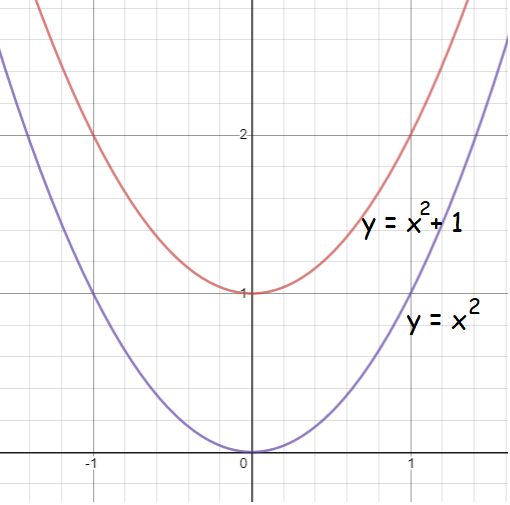
(c) g(x) = x2 + 1
Here 1 is added with the function, so we have to move the graph of the function 1 unit up.

Question 2 :
Define a function h by h(x) = f(x) − 1, where f is the function defined by f(x) = x2, with the domain of f the interval [−1, 1].
(a) Find the domain of h.
(b) Find the range of h.
(c) Sketch the graph of h.
Solution :
(a) Here h(x) is defined precisely defined by f(x). In other words, the domain of f equals the domain of f. Thus the domain of h is the interval [−1, 1].
(b) To find the range of h, we have to apply the values that we find the domain of f.
f(x) = x2
If x = -1, then y = 1
If x = 0, then y = 0
If x = 1, then y = 1
Then range of the function h(x) is [0, 1].By subtracting 1 from every values, we get the range of the function h(x) that is [-1, 0].
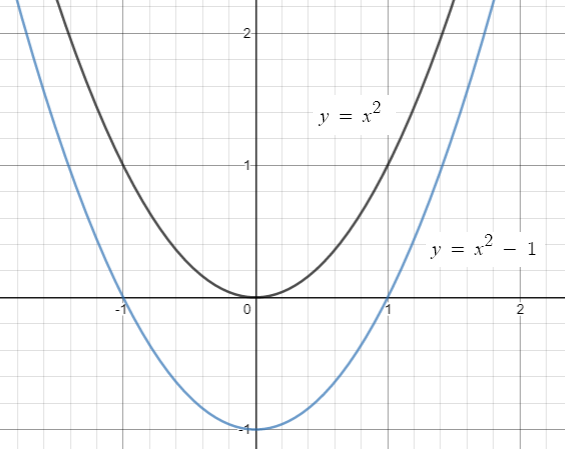
(c) h(x) = x2 - 1
Here 1 is subtracted from the function, so we have to move the graph of the function 1 unit .

Question 3 :
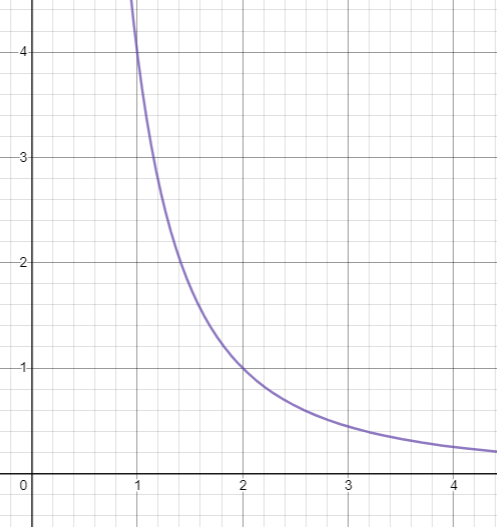
Assume that f is the function defined on the interval [1, 2] by the formula f(x) = 4 / x2. Thus the domain of f is the interval [1, 2], the range of f is the interval [1, 4], and the graph of f is shown here.
For each function g described below:
(a) Sketch the graph of g.
(b) Find the domain of g (the endpoints of this interval should be shown on the horizontal axis of your sketch of the graph of g).
(c) Give a formula for g.
(d) Find the range of g (the endpoints of this interval should be shown on the vertical axis of your sketch of the graph of g).
Solution :

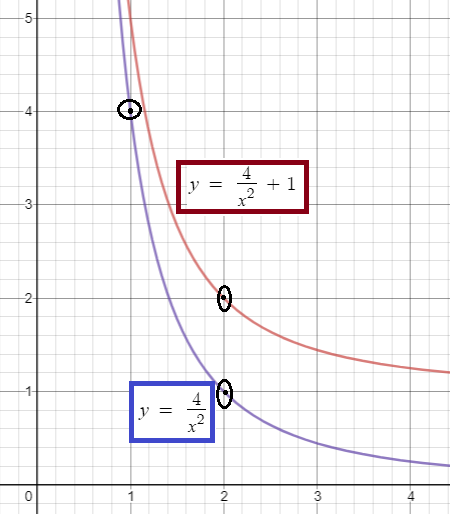
(a) By shifting the given graph, 1 unit up we get the graph of g.

(b) The domain of g is the same as the domain of f . Thus the domain of g is the interval [1, 2].
(c) Because the graph of g is obtained by shifting the graph of f up 1 unit, we have g(x) = f(x) + 1. Thus
g(x) = (4/x2) + 1
for each number x in the interval [1, 2].
(d) The range of g is obtained by adding 1 to each number in the range of f . Thus the range of g is the interval [2, 5].
Subscribe to our ▶️ YouTube channel 🔴 for the latest videos, updates, and tips.
Kindly mail your feedback to v4formath@gmail.com
We always appreciate your feedback.
About Us | Contact Us | Privacy Policy
©All rights reserved. onlinemath4all.com

Recent Articles
-
90 Degree Clockwise Rotation
Jan 01, 26 06:58 AM
90 Degree Clockwise Rotation - Rule - Examples with step by step explanation -
US Common Core K-12 Curriculum Algebra Solving Systems of Equations
Jan 01, 26 04:51 AM
US Common Core K-12 Curriculum - Algebra : Solving Systems of Linear Equations -
Solving the HARDEST SAT Math Questions ONLY using Desmos
Dec 31, 25 05:53 AM
Solving the HARDEST SAT Math Questions ONLY using Desmos
