TWO WAY RELATIVE FREQUENCY TABLES
Subscribe to our ▶️ YouTube channel 🔴 for the latest videos, updates, and tips.
When a two way table displays percentages or ratios (called relative frequencies), instead of just frequency counts, the table is referred to as two-way relative frequency table. These two-way tables can show relative frequencies for the whole table, for rows or for columns. Notice that the relative frequencies can be displayed as a ratio or a percentage or a decimal.
We can obtain the following relative frequencies from a two-way relative frequency table.
- A joint relative frequency is found by dividing a frequency that is not in the Total row or the Total column by the grand total.
- A marginal relative frequency is found by dividing a row total or a column total by the grand total.
- A two-way relative frequency table displays both joint relative frequencies and marginal relative frequencies.
Solved Examples
Example 1 :
A survey is conducted among school students. 50 students are randomly selected and they are asked, whether they prefer dogs, cats or other pets. In the survey, 10 boys preferred dogs, 9 boys preferred cats, 3 boys preferred other pets, 12 girls preferred dogs, 6 girls preferred cats and 10 girls preferred other pets. Construct a two-way relative frequency table for the above data.
Solution :
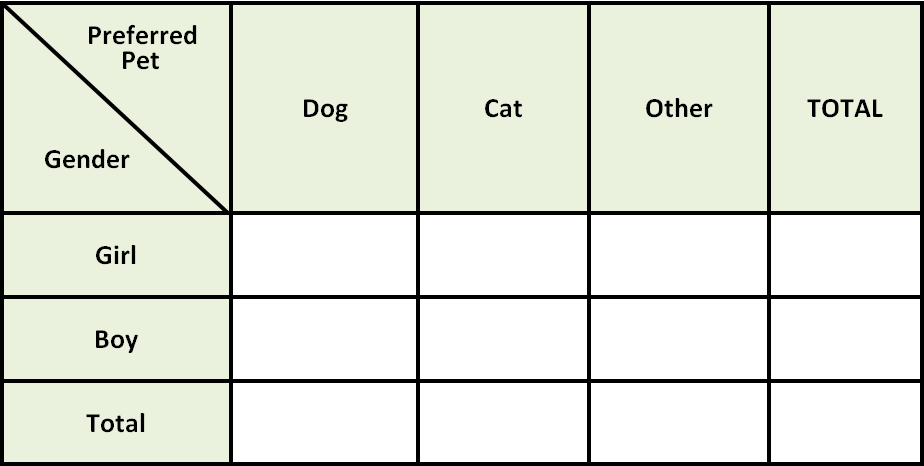
Step 1 :
Make a table by taking the categories "Boy" and "Girl" in rows and the categories "Dogs", "Cats" and "Other pets" in columns as given below.
Step 2 :
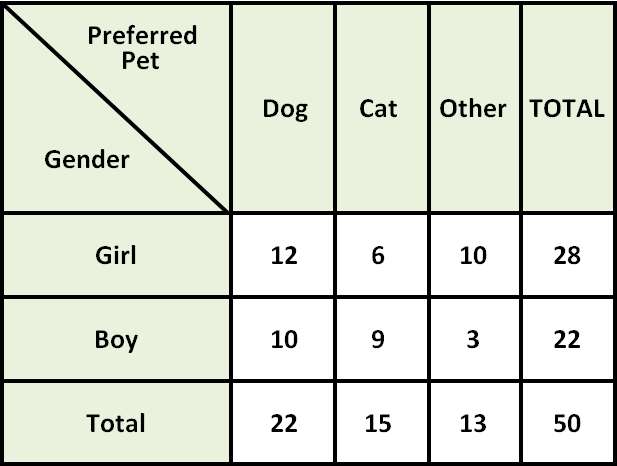
Fill the tables using the data given in the question.
Step 3 :
Find the total for each gender by adding the frequencies in each row.
Step 4 :
Find the total for each pet by adding the frequencies in each column.
Step 5 :
Find the grand total, which is the sum of the row totals as well as the sum of the column totals. Write this in the lower-right corner.
Step 6 :
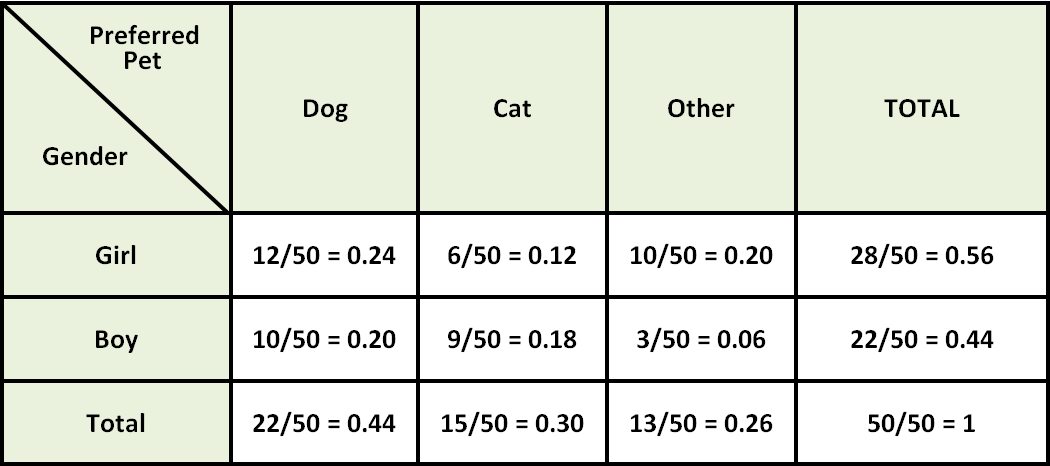
Divide each number in the above two-way frequency table by the grand total 50. Write the quotients as decimals.
Example 2 :
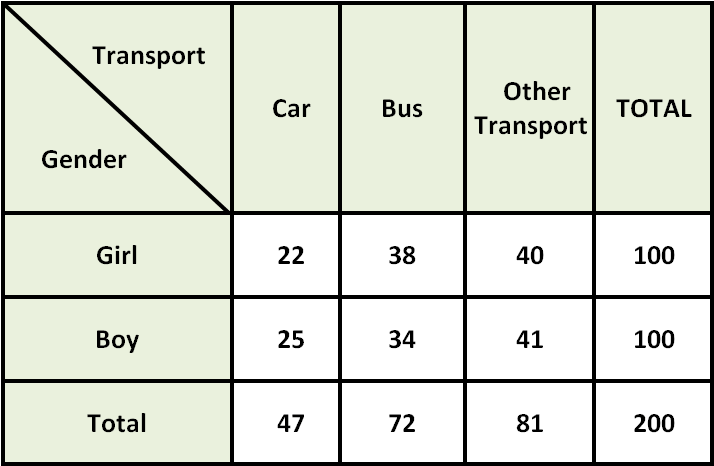
100 students in a middle school are asked, how they travel to school. 25 boys prefer car, 34 boys prefer bus, 41 boys prefer other transports, 22 girls prefer car, 38 girls prefer bus and 40 girls prefer other transports. Construct a two-way relative frequency table for the above data.
Solution :
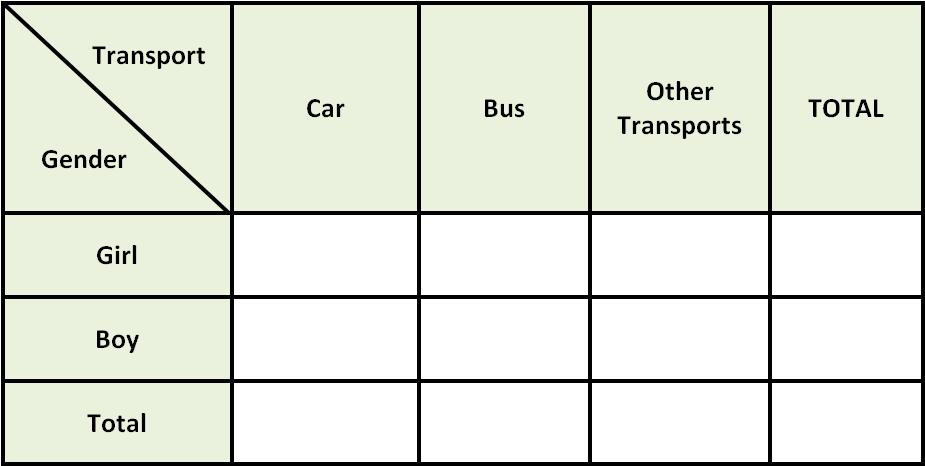
Step 1 :
Make a table by taking the categories "Boy" and "Girl" in rows and the categories "Car", "Bus" and "Other transports" in columns as given below.
Step 2 :
Fill the tables using the data given in the question.
Step 3 :
Find the total for each gender by adding the frequencies in each row.
Step 4 :
Find the total for each transport by adding the frequencies in each column.
Step 5 :
Find the grand total, which is the sum of the row totals as well as the sum of the column totals. Write this in the lower-right corner.
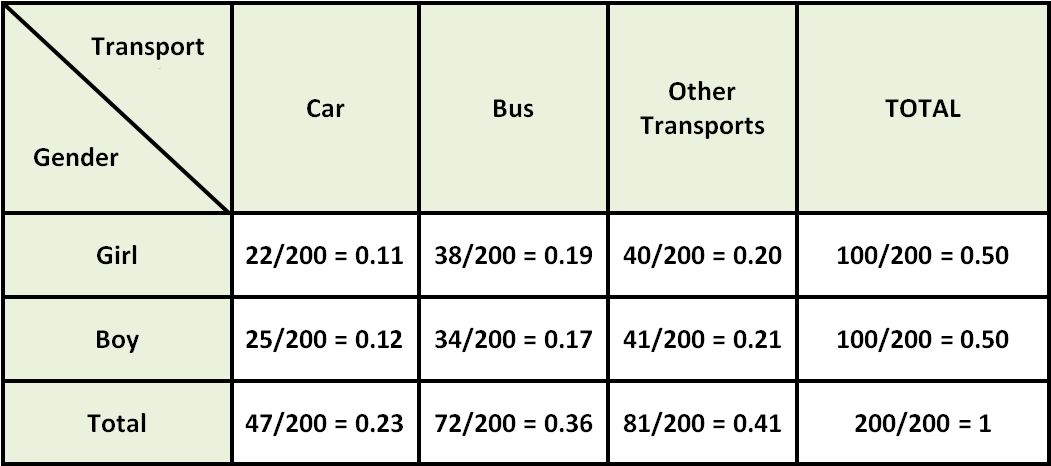
Step 6 :
Divide each number in the above two-way frequency table by the grand total 200. Write the quotients as decimals.
Subscribe to our ▶️ YouTube channel 🔴 for the latest videos, updates, and tips.
Kindly mail your feedback to v4formath@gmail.com
We always appreciate your feedback.
About Us | Contact Us | Privacy Policy
©All rights reserved. onlinemath4all.com

Recent Articles
-
AP Calculus AB Problems with Solutions (Part - 1)
May 29, 26 09:41 PM
 AP Calculus AB Problems with Solutions (Part - 1)
 -
SAT Math Practice Problems with Answers
May 21, 26 01:17 AM
 SAT Math Practice Problems with Answers
 -
Digital SAT Math Questions and Answers (Part - 13)
May 17, 26 09:03 AM
 Digital SAT Math Questions and Answers (Part - 13)


