USING EXPERIMENTAL PROBABILITY TO MAKE PREDICTIONS
Subscribe to our ▶️ YouTube channel 🔴 for the latest videos, updates, and tips.
The following steps will be useful to make predictions using experimental probability.
Step 1 :
Using the given data, find experimental probability of an event.
Step 2 :
Make predictions by multiplying experimental probability and total number of trials.
Example 1 :
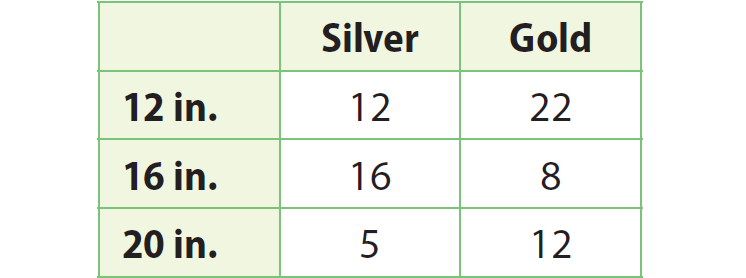
The table shows the number of necklaces sold in three sizes and two different metals by a jeweler in January 2017. If had sold 100 necklaces in February 2017, about how many 20-inch gold necklaces would he have sold ?
Solution :
Step 1 :
Since we want to make predictions for 20-inch gold necklaces, first we have to find experimental probability for 20-inch gold necklaces from the given data.
Find experimental probability for 20-inch gold necklaces.
Total no. of necklaces is
= 12 + 16 + 5 + 22 + 8 + 12
= 75
Step 2 :
Find the no. of 20-inch gold necklaces.
No. of 20-inch gold necklaces = 12.
Step 3 :
Find the probability.

Experimental probability = 12/75
Simplify.
Experimental probability = 4/25
Step 4 :
Now make prediction for 20-inch gold necklaces in the total of 100 necklaces sold in Feb 2017.
Multiply the experimental probability and the total number of necklaces sold in Feb.
= (4/25) x 100
Simplify.
= 4 x 4
= 16
So, he would have sold sixteen 20-inch gold necklaces in Feb 2017.
Example 2 :
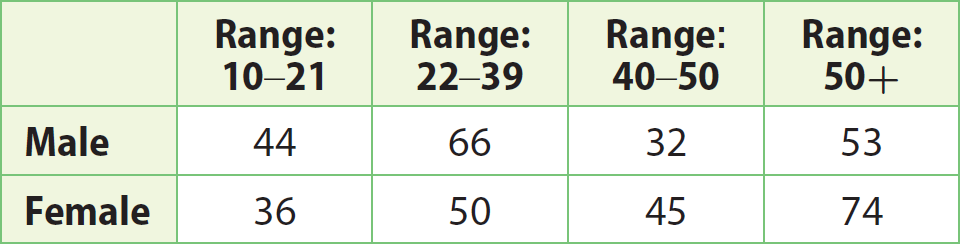
The table given below shows the number of male and female patients that range in ages from 10 years old to 50 years old having had by a dentist in the year 2015. If the dentist had 600 patients in the year 2016, about how many female patients in the age range 22–39 can be expected ?
Solution :
Step 1 :
Find the total no. of patients.
Total no. of patients is
= 44 + 66 + 32 + 53 + 36 + 50 + 45 + 74
= 400
Step 2 :
Find the no. of female patients in the age range 22 - 39.
No. of female patients in the age range 22 - 39 = 50
Step 3 :
Find the probability.
Experimental probability = 50/400
Simplify.
Experimental probability = 1/8
Step 4 :
Now make prediction for female patients in the age range 22–39.
Multiply the experimental probability and the total number of patients in the year 2016.
= (1/8) x 600
= 600/8
Simplify
= 75
In the year, 75 female patients in the age range 22–39 can be expected.
Subscribe to our ▶️ YouTube channel 🔴 for the latest videos, updates, and tips.
Kindly mail your feedback to v4formath@gmail.com
We always appreciate your feedback.
About Us | Contact Us | Privacy Policy
©All rights reserved. onlinemath4all.com
Recent Articles
-
10 Hard SAT Math Questions (Part - 40)
Dec 25, 25 08:30 AM
 10 Hard SAT Math Questions (Part - 40)
 -
10 Hard SAT Math Questions (Part - 41)
Dec 24, 25 07:58 PM
 10 Hard SAT Math Questions (Part - 41)
 -
ASTC Formula in Trigonometry
Dec 23, 25 11:34 PM
 ASTC Formula in Trigonometry - Concepts - Examples and Solved Problems


